iGaming Player Retention Metrics That Actually Predict Revenue

Most iGaming operators measure growth by acquisition volume. Traffic increases, registrations climb, and first time deposits look strong. Campaign efficiency improves, cost per acquisition looks stable, and channel volume appears scalable. On paper, it reads like progress.
But none of those metrics prove the business is profitable.
There is one equation that determines whether an operator is truly scaling: Lifetime Value must significantly exceed Player Acquisition Cost. When that spread is wide, growth compounds because every new player funds reinvestment. When the spread narrows, profitability becomes fragile, and the business becomes sensitive to churn, incentive intensity, and short term volatility. When PAC overtakes LTV, scale turns into structural loss.
If you do not actively manage that ratio, you are not managing growth. Sustainable performance in iGaming is about how much durable value each player generates over time.
Why Acquisition Numbers Lie
Acquisition metrics move fast and look impressive. Registrations rise, first deposits increase, and channel volume scales. Marketing looks efficient.
But acquisition measures activity, not durability.
You can double registrations and still reduce profitability if player retention weakens and player churn rises in month two. Bonus heavy campaigns may inflate early deposits while Net Gaming Revenue per cohort declines.
The gap sits between teams. Marketing tracks volume. Finance tracks revenue. Retention tracks engagement. Few connect them through lifecycle economics.
That connection is the PAC to LTV ratio.
If PAC approaches LTV, you are operating at break even. If PAC exceeds LTV, growth amplifies loss. Customer retention analytics reveal whether player retention is strengthening value or compressing margin.
Player Acquisition Cost (PAC): The Number That Sets the Ceiling
What it measures
Player Acquisition Cost measures how much you spend to acquire one depositing player. It defines the economic hurdle your player retention strategy must clear, since every euro invested must be recovered through Net Gaming Revenue.
PAC sets the ceiling for sustainable growth. If Lifetime Value does not rise comfortably above PAC, scale becomes fragile, even when acquisition appears efficient.
How to calculate it
PAC = Total acquisition spend ÷ New depositing players
This calculation must include the full acquisition cost base, not just media spend. Many operators understate PAC by excluding affiliate commissions, welcome bonuses, and overhead that is directly tied to acquisition performance.
Include:
- Paid media
- Affiliate commissions
- Welcome bonuses and free bets
- Acquisition linked marketing overhead
- Agency or partner fees
Example
If you spend €300,000 in a month and acquire 2,500 depositing players, PAC equals €120 per player.
That €120 must be recovered and exceeded through Lifetime Value. Until recovery occurs, the player is not profitable, regardless of deposit activity in week one.
Healthy benchmark
For most regulated iGaming markets, a minimum 1 to 3 PAC to LTV ratio is required for sustainable reinvestment. If PAC is €120, LTV should exceed €360.
That spread is not “extra.” It funds compliance, customer support, fraud prevention, CRM execution, platform costs, payment operations, and continued acquisition. A thinner ratio leaves no room for volatility. A wider ratio creates strategic flexibility and resilience.
The spread between PAC and LTV determines whether growth compounds or strains the system.
Warning signs
- PAC rising month over month without corresponding LTV growth
- Heavy affiliate reliance inflating commission structures
- Bonus heavy acquisition driving artificial deposit spikes
- PAC exceeding 40 to 50 percent of projected 12 month LTV
When PAC inflates faster than LTV, profitability compresses immediately, even if top line revenue still looks strong. Volume can hide the problem in the short term. Margin cannot.
What to do when it is off
There are only two levers:
- Reduce inefficient acquisition spend
- Increase LTV through stronger player retention
Cutting spend protects margin but slows scale. Improving player retention strengthens capital efficiency because it increases the value extracted from each acquired player without increasing upfront cost. In practice, most operators do not need “more acquisition.” They need stronger post deposit retention mechanics that convert early activity into sustained revenue.
Lifetime Value (LTV): The Number PAC Has to Beat
What it measures
Lifetime Value estimates the total Net Gaming Revenue a player generates over their active lifecycle. In iGaming, LTV is driven by player retention performance, churn control, and monetization depth, not acquisition volume.
Two operators can acquire players at the same PAC and produce very different outcomes depending on how they manage player retention after first deposit. LTV determines whether acquisition spend becomes reinvestable growth or ongoing subsidy.
How to calculate it
A simplified model is:
LTV = Average monthly NGR × Average player lifespan (months)
If average monthly NGR per player is €45 and average lifespan is 9 months, LTV equals €405.
Now compare that to PAC.
If PAC is €150, the ratio is roughly 1 to 2.7. That can be viable, but it is below the preferred 1 to 3 benchmark. If PAC is €180, the spread narrows further and the model becomes sensitive to churn and incentive cost. The ratio tells the real story.
Healthy benchmark
LTV should exceed PAC by at least 3x to create stable long term economics. A 4x ratio provides strategic flexibility, which matters in iGaming because market conditions change quickly. The wider the spread between LTV and PAC, the more resilient the business becomes during seasonal volatility, affiliate inflation, or bonus wars.
Warning signs
- LTV declining across recent acquisition cohorts
- Strong first month revenue followed by steep player churn
- Second month retention below expectation
- Rising bonus cost eroding NGR contribution
Most LTV underperformance does not originate in acquisition. It originates in weak player retention systems, especially after the welcome bonus period ends.
Common drivers include poor onboarding, limited segmentation, no structured reactivation, and generic incentive allocation that treats all players the same. When retention execution weakens, lifespan shortens. When lifespan shortens, LTV declines. When LTV declines, the PAC to LTV ratio tightens, often before anyone notices it in the acquisition dashboard.
What to do when it is off
Increasing player lifespan by even one or two months can materially shift LTV.
If lifespan increases from 9 to 11 months at €45 monthly NGR, LTV rises from €405 to €495 without increasing acquisition spend. That improvement alone can restore a fragile ratio to a sustainable one.
This is why player retention is the lever that improves growth economics without increasing upfront risk. Intelligent segmentation, proactive reactivation outreach, and tier based lifecycle management strengthen LTV while keeping PAC stable. LTV is not static. It is an operational outcome of your player retention infrastructure.
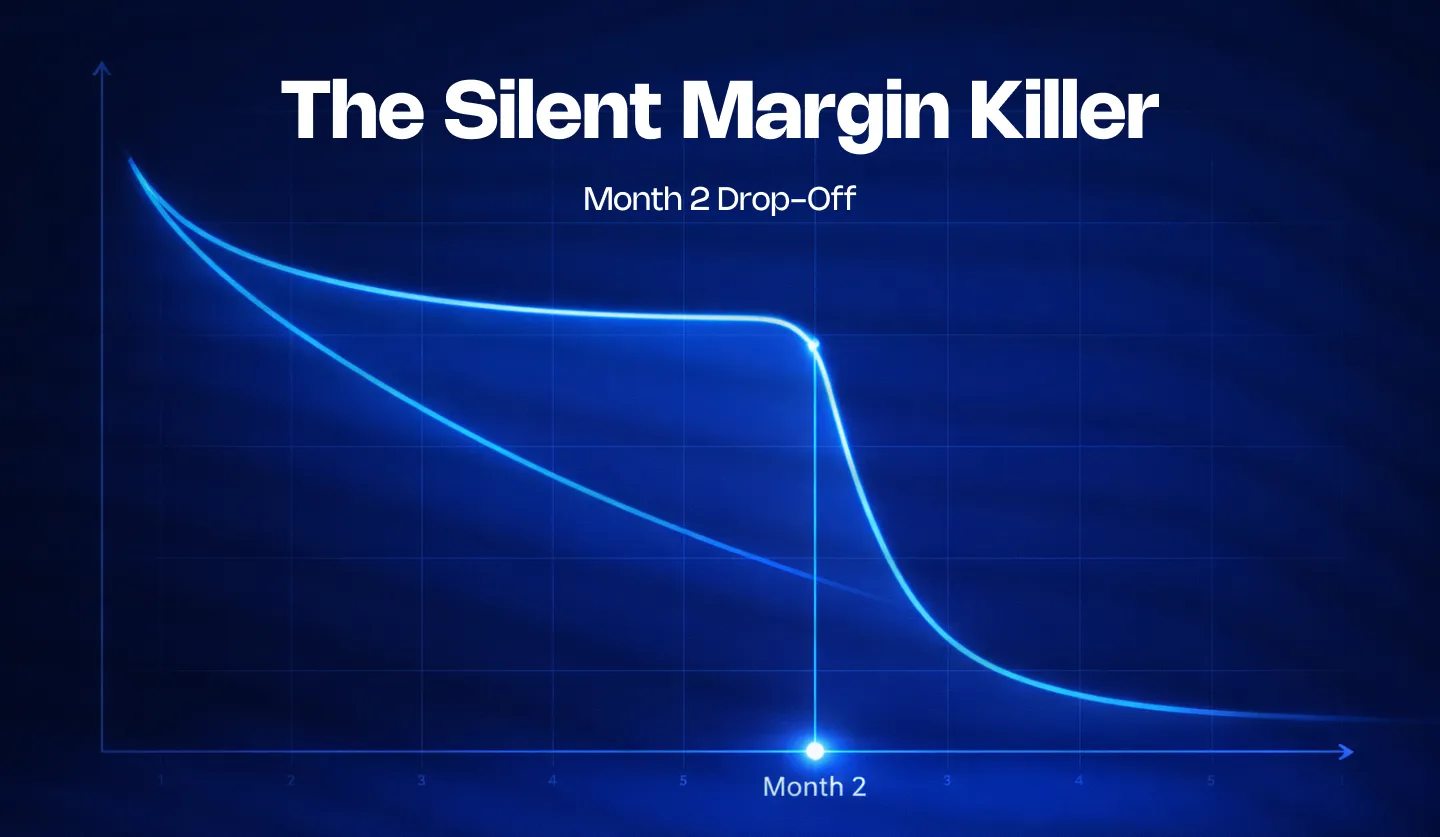
Churn Rate: The Silent Margin Killer
What it measures
Churn rate measures the percentage of players who stop depositing or engaging within a defined period, showing how quickly lifecycle value is leaking from your active base. In iGaming, player churn usually rises gradually, which makes it easy to overlook.
Even small increases in player churn shorten lifespan, reduce LTV, and tighten the PAC to LTV ratio. As lifespan declines, projected value drops and acquisition efficiency weakens.
How to calculate it
Churn Rate = Players lost during period ÷ Active players at start
If you begin the month with 12,000 active players and 1,800 stop depositing during that period, churn equals 15 percent. The trend matters more than the number itself. Operators should track churn by cohort and by value tier, because average churn can hide critical leakage in mid tier segments.
Healthy benchmark
Benchmarks vary by product vertical and market, but stability is critical. Rising month over month churn often signals weaknesses in onboarding, incentive alignment, payment experience, or ongoing engagement strategy. Second month churn is especially important. If players disengage shortly after completing welcome bonus requirements, the acquisition investment has limited opportunity to convert into durable value.
In this way, player churn functions as an early indicator of pressure on LTV and therefore on the overall player retention economics.
Warning signs
- Sharp drop off after welcome bonus expiry
- No structured reactivation framework
- Growing inactivity among mid tier players
- Declining repeat deposit rates
When these patterns appear, projected LTV becomes less reliable and the business becomes increasingly dependent on constant acquisition to replace lost value.
The financial impact
Even modest improvements in churn can produce meaningful revenue gains. For example, if average LTV is €400 and a reduction in churn extends player lifespan by one additional month, LTV may increase to €440 or more.
Across 10,000 players, that €40 increase translates into €400,000 in additional projected lifetime revenue. When applied across multiple cohorts, the impact compounds.
For operators focused on sustainable growth, player churn should not be viewed solely as a CRM performance metric. It is a financial control variable that directly influences Lifetime Value and determines whether player retention strengthens or weakens acquisition efficiency.
ARPU: Are Your Players Actually Generating Revenue?
What it measures
Average Revenue Per User measures how much revenue each active player generates within a defined period. More than a surface level metric, ARPU reveals revenue depth and player value distribution.
ARPU shows whether engagement converts into meaningful Net Gaming Revenue. Within a player retention framework, it indicates how effectively the active base is monetized and whether lifecycle strategy aligns with player value.
How to calculate it
ARPU = Total revenue ÷ Active players
If revenue is €600,000 and active players total 12,000, ARPU equals €50. The calculation is simple. The interpretation is not.
Healthy benchmark
The absolute ARPU number matters less than how it is distributed across segments. A single blended figure can hide structural imbalance inside the player base. ARPU should be segmented by acquisition channel, product vertical, geography, and player value tier.
Customer retention analytics frequently reveal concentration risk, where 20 percent of players generate 70 to 80 percent of total revenue. Some concentration is natural in iGaming, but extreme imbalance increases vulnerability. If a small VIP segment drives the majority of value, volatility risk rises and mid tier monetization becomes a missed opportunity.
Warning signs
- High registration volume paired with stagnant or declining ARPU
- Acquisition channels producing deposits but weak repeat contribution
- Overreliance on a narrow VIP segment
- Large segments of active players generating minimal NGR
When most players contribute little to Net Gaming Revenue, acquisition volume can mask structural weakness in player retention strategy. The business becomes dependent on constantly replacing low value players rather than increasing lifecycle depth. Weak ARPU ultimately suppresses NGR, which limits LTV and tightens the PAC to LTV ratio.
What to do
Improving ARPU requires disciplined segmentation and aligned incentives. Uniform bonus structures weaken monetization, while value tier differentiation and structured lifecycle journeys increase revenue without inflating acquisition cost.
Mid tier players offer the greatest opportunity for ARPU expansion. Increasing their engagement and deposit frequency strengthens Lifetime Value, stabilizes ARPU, and makes player retention a compounding driver of growth.
Net Gaming Revenue: The Number That Actually Matters
What it measures
Net Gaming Revenue reflects retained revenue after bonuses, promotions, and adjustments are deducted from Gross Gaming Revenue. While GGR shows betting activity, NGR reveals what the business actually keeps.
This distinction matters because aggressive incentives can inflate GGR while eroding margin. When player retention is weak, higher bonuses may sustain deposits, but NGR declines and profitability weakens.
Formula
NGR = GGR - Bonuses - Promotions - Adjustments
During acquisition surges, GGR may rise sharply. If bonus cost rises alongside it, NGR may stagnate or decline despite higher betting volume. This is one of the most common ways operators misread growth.
Healthy benchmark
Healthy NGR performance is reflected in stable or rising NGR per cohort over time. Revenue growth should align with improvements in player retention performance, ARPU stability, and churn control, not simply with acquisition bursts or aggressive promotional cycles.
When NGR per player increases alongside improving player retention metrics, the PAC to LTV ratio strengthens in a sustainable way.
Warning signs
- GGR rising while NGR declines
- Bonus heavy campaigns masking weak player retention
- High PAC justified by short term revenue spikes
- Increasing incentive intensity required to maintain deposits
If incentives inflate early deposits but fail to drive sustained engagement, projected LTV deteriorates. Once LTV declines, the spread between acquisition cost and lifetime revenue narrows, and the PAC to LTV ratio begins to weaken. NGR exposes that pressure early and forces clarity on whether growth is real or subsidized.
Protecting NGR requires disciplined segmentation and controlled bonus strategy rooted in strong player retention execution.

Reading the Five Metrics Together
Individually, these metrics inform. Together, they diagnose.
Player Acquisition Cost defines the cost of growth. Lifetime Value defines revenue capacity. Churn rate shapes lifespan. ARPU reveals monetization depth. Net Gaming Revenue confirms retained margin.
There are three states.
If LTV exceeds PAC, growth compounds through player retention.
If LTV approximates PAC, economics are fragile.
If LTV falls below PAC, scale becomes structural loss.
Sustainable operators monitor how these metrics move together. When PAC stays controlled, LTV expands, player churn declines, ARPU stabilizes, and NGR rises per cohort, acquisition becomes reinvestable.
The PAC to LTV ratio remains the anchor. Everything else feeds into it.
Conclusion
Acquisition without player retention visibility is a growth trap. Registrations do not equal revenue, and deposits do not equal profit. If Lifetime Value does not materially exceed Player Acquisition Cost, growth may be compressing margin rather than building it.
Strong player retention requires financial discipline. Player churn must be managed as a revenue risk, ARPU must be segmented by value tier, and Net Gaming Revenue must be protected through controlled incentives.
Operators who master player retention metrics scale with control, not exposure. Converst strengthens the spread between PAC and LTV by increasing lifecycle value, reducing player churn, and protecting NGR with measurable impact.

FAQ
What is a good player retention rate in iGaming?
There is no single benchmark that applies across all markets and products. A better standard is cohort stability, especially in month two and month three, because early player retention is highly predictive of Lifetime Value. Operators should track retention by acquisition channel and player tier to avoid averages that hide churn concentration.
How do you calculate LTV for casino players?
A practical approach is to multiply average monthly Net Gaming Revenue per player by average active lifespan in months. More advanced models use cohort based forecasting that accounts for churn probability and different value tiers, which improves accuracy and makes LTV more actionable for decision making.
What causes high churn rate in online gambling?
High player churn is typically driven by weak onboarding, irrelevant incentives, lack of segmentation, payment friction, and poor post bonus engagement. In many cases, churn rises because operators treat player retention as a campaign activity instead of a structured lifecycle system.
What is the difference between GGR and NGR?
GGR is wagers minus winnings and represents gross betting activity. NGR subtracts bonuses, promotions, free bets, and adjustments from GGR, reflecting the revenue retained by the operator. NGR is the stronger indicator of profitability because it incorporates incentive cost.