iGaming Engagement Metrics That Signal Churn Before It Happens
Most iGaming churn becomes predictable 2–4 weeks before players stop logging in. The earliest signals appear not in retention reports but in engagement metrics.
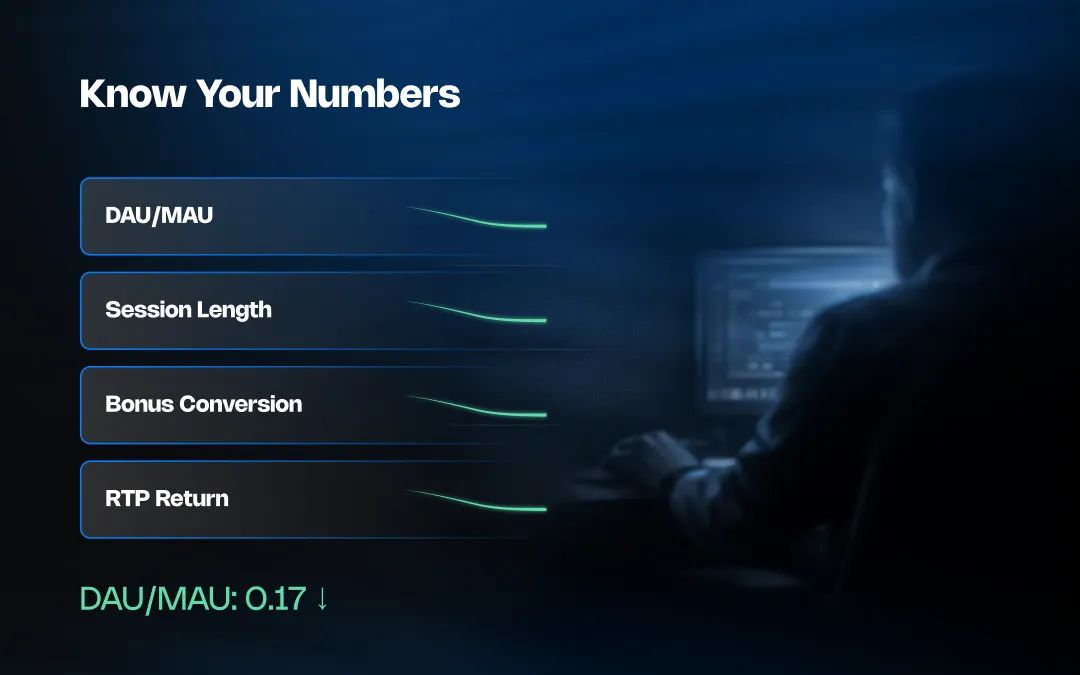
Customer engagement iGaming metrics reveal how consistently players return, play, and respond to your platform. The metrics that predict churn earliest are DAU/MAU ratio, session length, RTP return rate, bonus conversion rate, and active player ratio, which typically begin declining two to four weeks before churn appears in retention reports.
Why Engagement Metrics Are a CX Early Warning System
Engagement metrics act as leading indicators of churn in iGaming because they reveal changes in player behavior weeks before retention data confirms that players have left, giving CX teams a critical window to intervene while players are still active.
Retention metrics are lagging indicators. They show the outcome of churn after it has already happened, for example, when a player fails to return after 30 days.
Engagement metrics track how players interact with your platform while they are still active. Frequency of visits, time spent per session, and responsiveness to promotions all reveal changes in player interest before inactivity appears in retention reports.
Player churn rarely happens suddenly. Most players go through a behavioral decline phase that unfolds over several weeks:
1. Sessions become shorter
2. Logins become less frequent
3. Promotions stop converting
4. Eventually the player stops returning
Engagement metrics capture the first two stages of that decline.
For example, a sportsbook player may still log in daily but reduce their session length from 18 minutes to 10 minutes. A casino player may continue playing but stop converting bonuses. Neither player has churned yet, but both are already drifting.
For CX teams, this behavioral window is the opportunity to intervene.
When operators track engagement metrics together, including DAU/MAU ratio, session length, RTP return rate, bonus conversion rate, and active player ratio, they create an early warning system for player disengagement. That system allows CX teams to trigger proactive outreach, targeted incentives, or VIP contact before the player decides to leave.
The following engagement metrics form the foundation of that predictive churn detection layer.
Active Player Ratio – What Your DAU/MAU Number Actually Means
The DAU/MAU ratio is the percentage of monthly active players who return to play on a given day. It measures how frequently players engage with your platform and is one of the clearest indicators of engagement consistency.
The formula is straightforward:
DAU/MAU Ratio = Daily Active Users ÷ Monthly Active Users
If a platform has 10,000 monthly active players and 2,200 daily active players, the DAU/MAU ratio is 0.22.
This metric is commonly called the stickiness ratio because it reflects how habit-forming your platform experience is. In gaming environments, a ratio above 0.20 is generally considered healthy. It means roughly one in five players returns every day, indicating strong engagement and regular play behaviour.
When the ratio begins to decline, it signals a shift in player visit frequency rather than player volume.
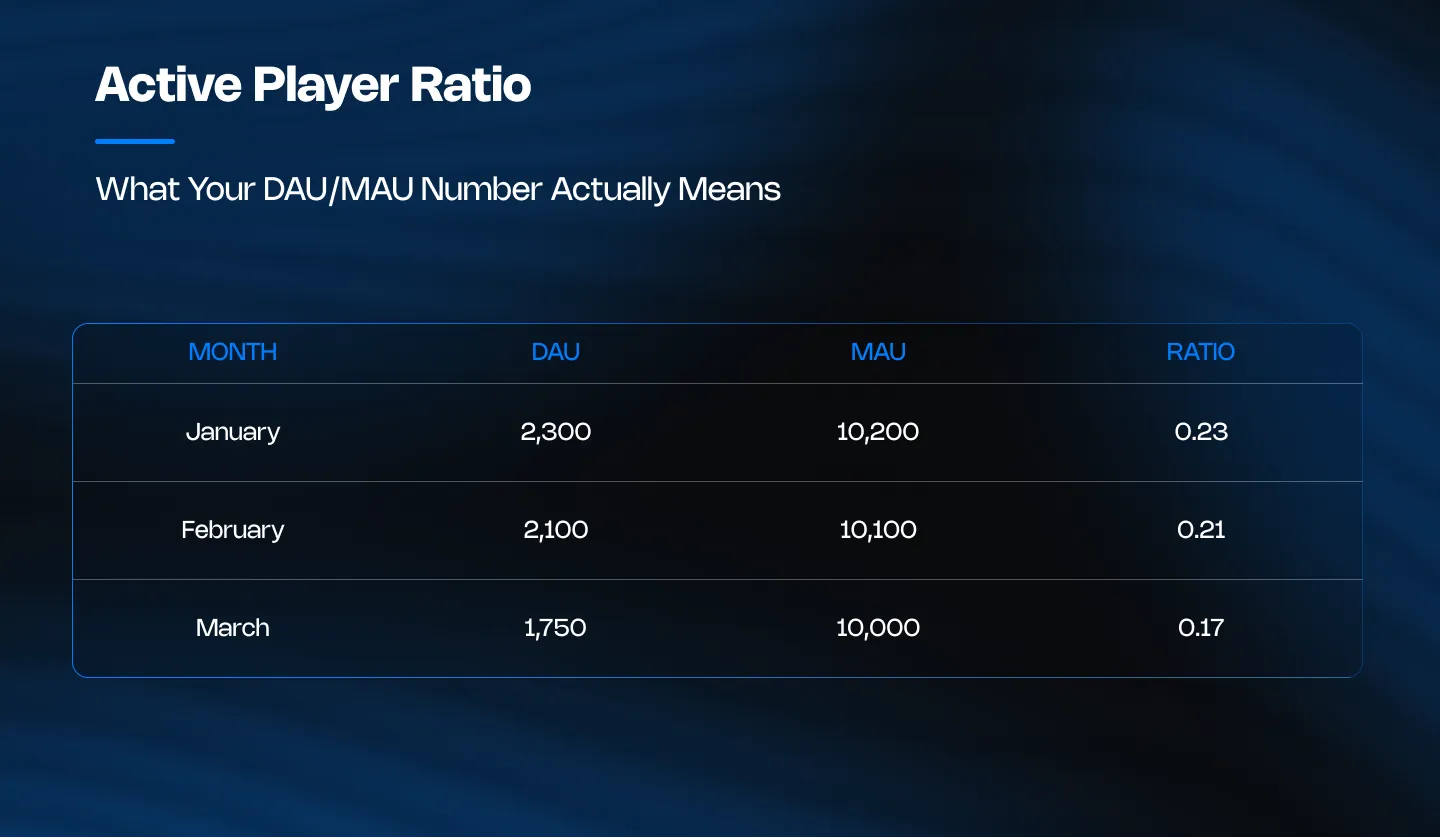
In this example, the total player base remains stable while daily engagement drops steadily. Players are still registered as active, but they are returning less often.
This pattern frequently appears weeks before churn becomes visible in retention data. Reduced visit frequency weakens the habit loops that keep players returning to a platform.
The segments to watch most closely when the ratio declines are:
- High-frequency casino players
- VIP sports bettors
- New players in their first 30 days
These segments generate disproportionate revenue and often reveal engagement drift first. A declining stickiness ratio among them should trigger immediate segmentation analysis and proactive CX outreach.
How to Read DAU/MAU Trends Over Time
DAU/MAU trends matter more than individual values. A single low ratio may reflect seasonality or promotional timing. A consistent downward trend signals disengagement.
For example, a ratio that drops from 0.22 to 0.15 over six weeks tells a story that goes beyond a sequence of numbers. These values indicate a structural shift in engagement. Players are returning less often even though they have not yet churned, making this the right moment to trigger actions that can prevent it.
Trend monitoring should focus on:
- 6–8 week rolling averages
- Segment-level ratios (VIP vs casual players)
- Channel cohorts (sportsbook vs casino)
When frequency declines steadily, operators should trigger targeted reactivation campaigns before inactivity becomes permanent. Proactive outreach, personalised offers, and direct player engagement can reverse disengagement while the player is still active and before churn begins affecting retention metrics.
Game Session Length – The Metric That Moves Before Everything Else
Session length is the average amount of time a player spends actively using your platform during a single visit. It measures session depth and often signals disengagement before other engagement metrics begin to decline.
It is calculated by dividing total play time by total sessions over a defined period.
Session Length = Total Gameplay Time ÷ Total Sessions
Session duration often declines before any other engagement metric. Players typically reduce the time they spend playing before they reduce how often they log in.
A typical early-warning pattern might look like this:
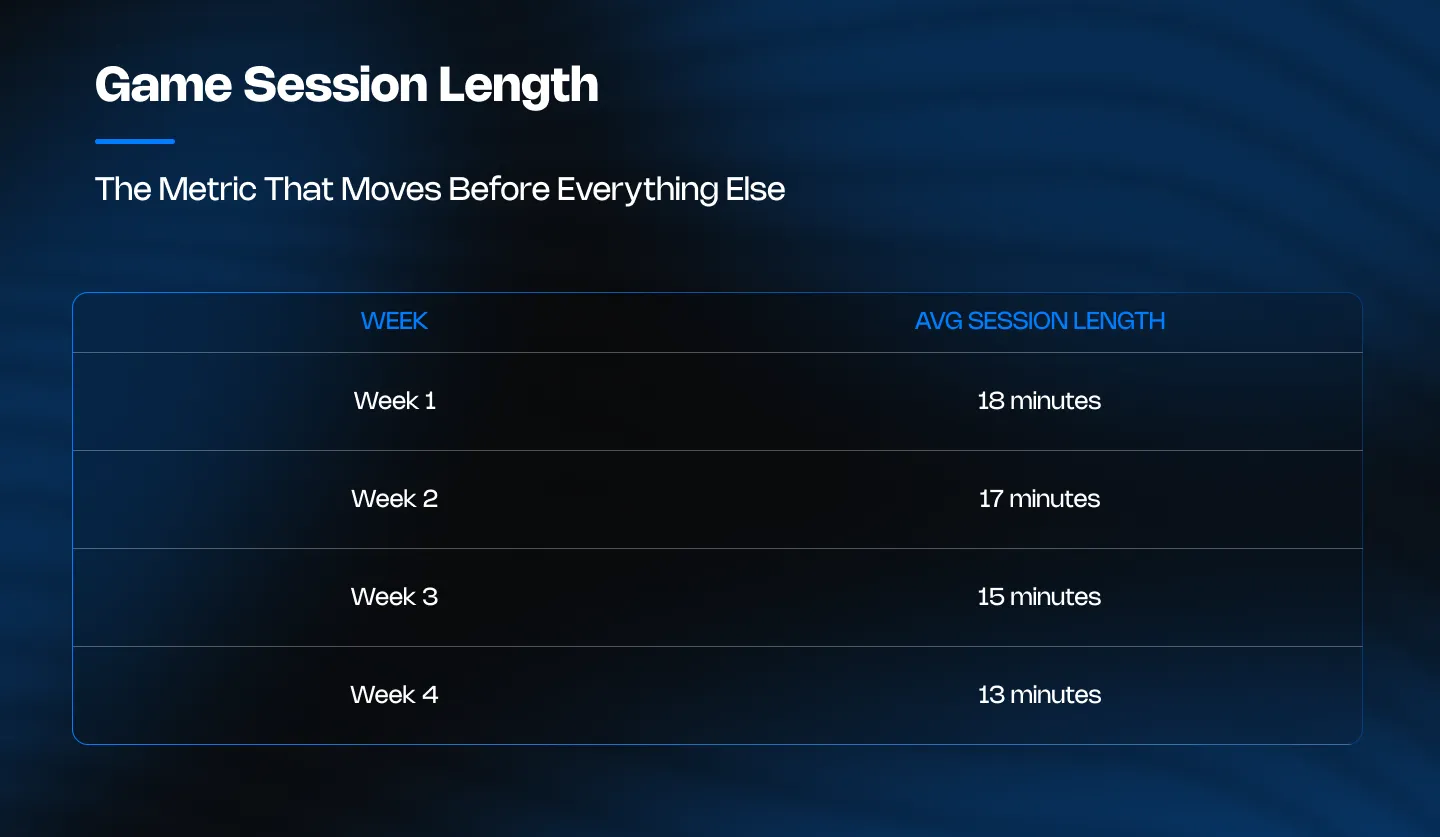
Players are still logging in regularly, but sessions are becoming shorter. This is a classic early-stage disengagement signal.
Several factors can contribute to declining session length:
- Reduced excitement from games or promotions
- Friction in payments or withdrawals
- Loss fatigue following losing streaks
- Platform experience issues
Healthy session benchmarks vary by player segment:
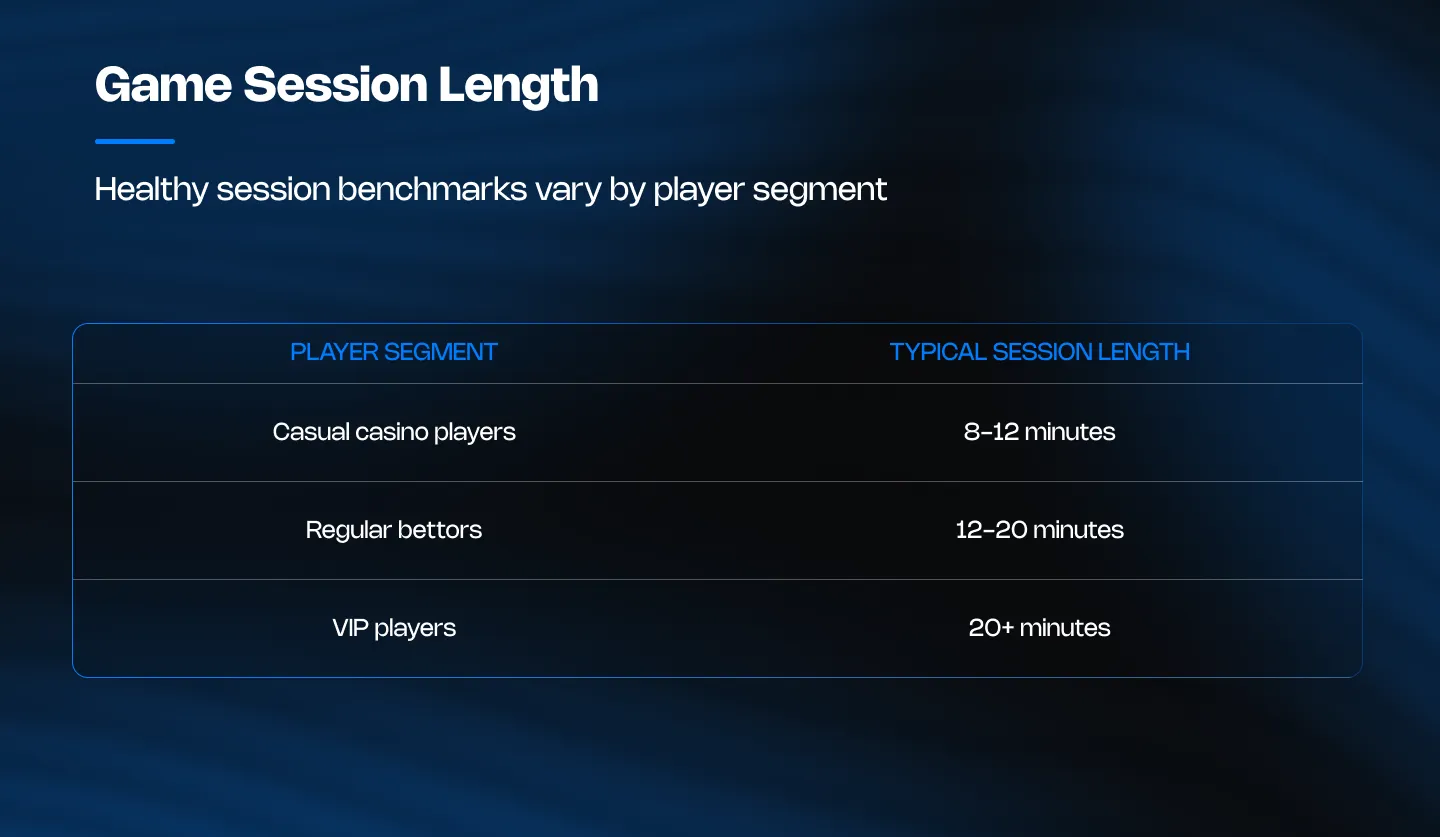
High-value segments are particularly sensitive to session depth. VIP players often shorten their sessions before they reduce visit frequency, making session length one of the most reliable early indicators of upcoming churn.
When session length begins to decline — especially among high-value segments — CX teams should intervene quickly. Personalised outreach, tailored incentives, or VIP account manager engagement can often restore player momentum while the player is still active.
Return to Player (RTP) Rate – Separating Volatility from Disengagement
RTP return rate is the percentage of total player wagering that returns to the player over a defined period.Unlike game RTP settings, this metric reflects actual player outcomes across real sessions and wagers.
It is calculated as:
Player RTP Return Rate = Total Winnings ÷ Total Wagered
Short-term fluctuations in RTP are normal because gaming outcomes include natural variance. However, extended periods of low returns often increase churn risk, particularly among high-value players.
Players experiencing prolonged losing streaks often begin to:
- Shorten session length
- Reduce bet sizes
- Stop redeeming promotions
If RTP return rates drop significantly for specific segments — particularly VIP players — the likelihood of disengagement increases sharply.
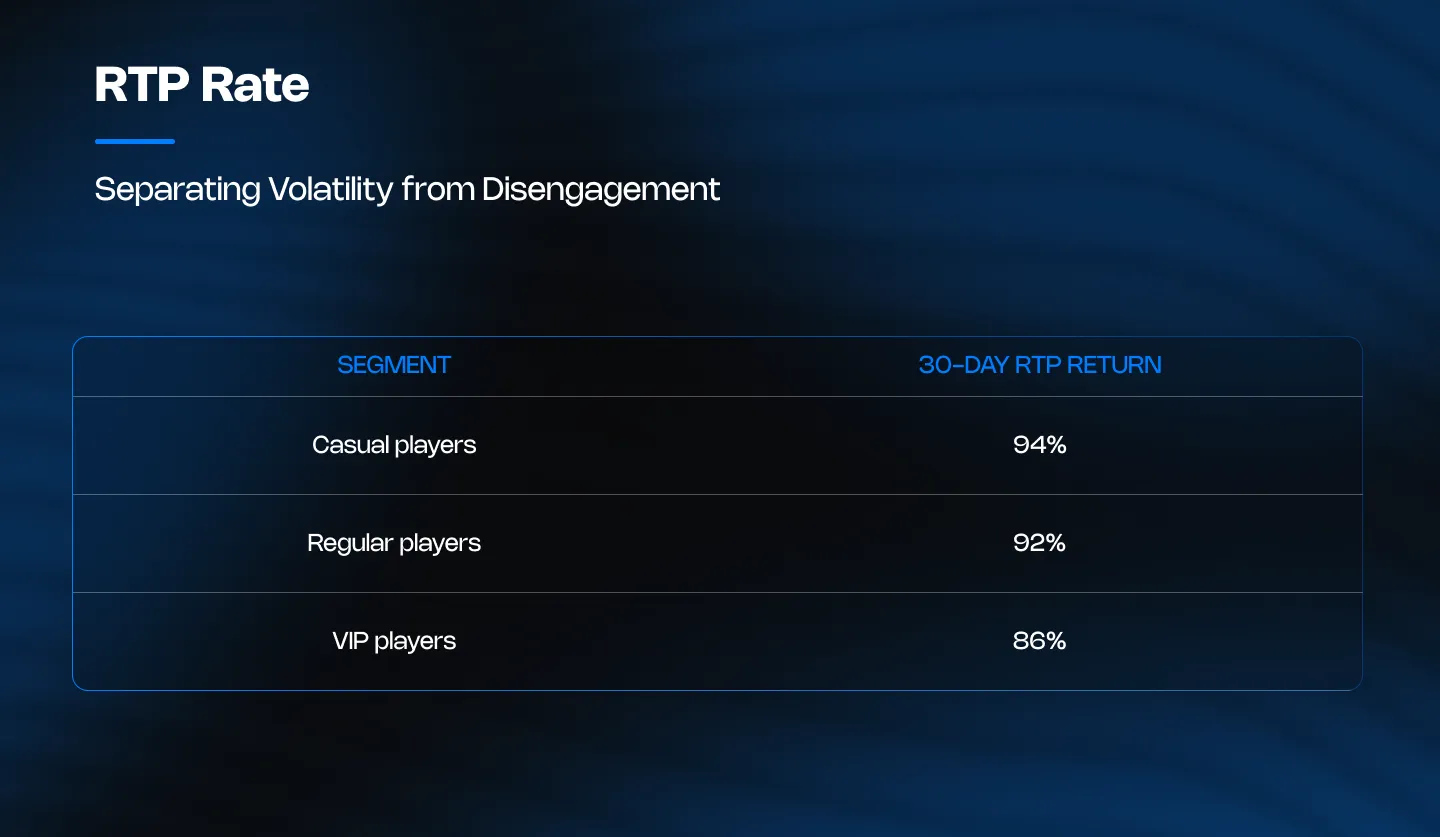
A sudden drop in RTP returns among high-value players often leads to disengagement within weeks.
CX teams can mitigate this risk through targeted recovery offers, cashback incentives, or direct VIP outreach that restores perceived value and encourages continued play.
Monitoring RTP alongside session length and DAU/MAU trends helps operators distinguish between normal variance and genuine engagement decline.
Bonus Conversion Rate – When Promotions Stop Working
Bonus conversion rate is the percentage of issued promotional bonuses that players successfully convert into real-money wagering activity. It measures how effectively promotions drive engagement and gameplay.
The formula is simple:
Bonus Conversion Rate = Converted Bonuses ÷ Issed Bonuses
If 5,000 bonuses are issued and 1,000 are converted, the conversion rate is 20%.
Declining conversion rates usually indicate one of two issues:
- Offer fatigue — players no longer find promotions appealing
- Player disengagement — players stop responding to incentives altogether
Both signals point to declining engagement.
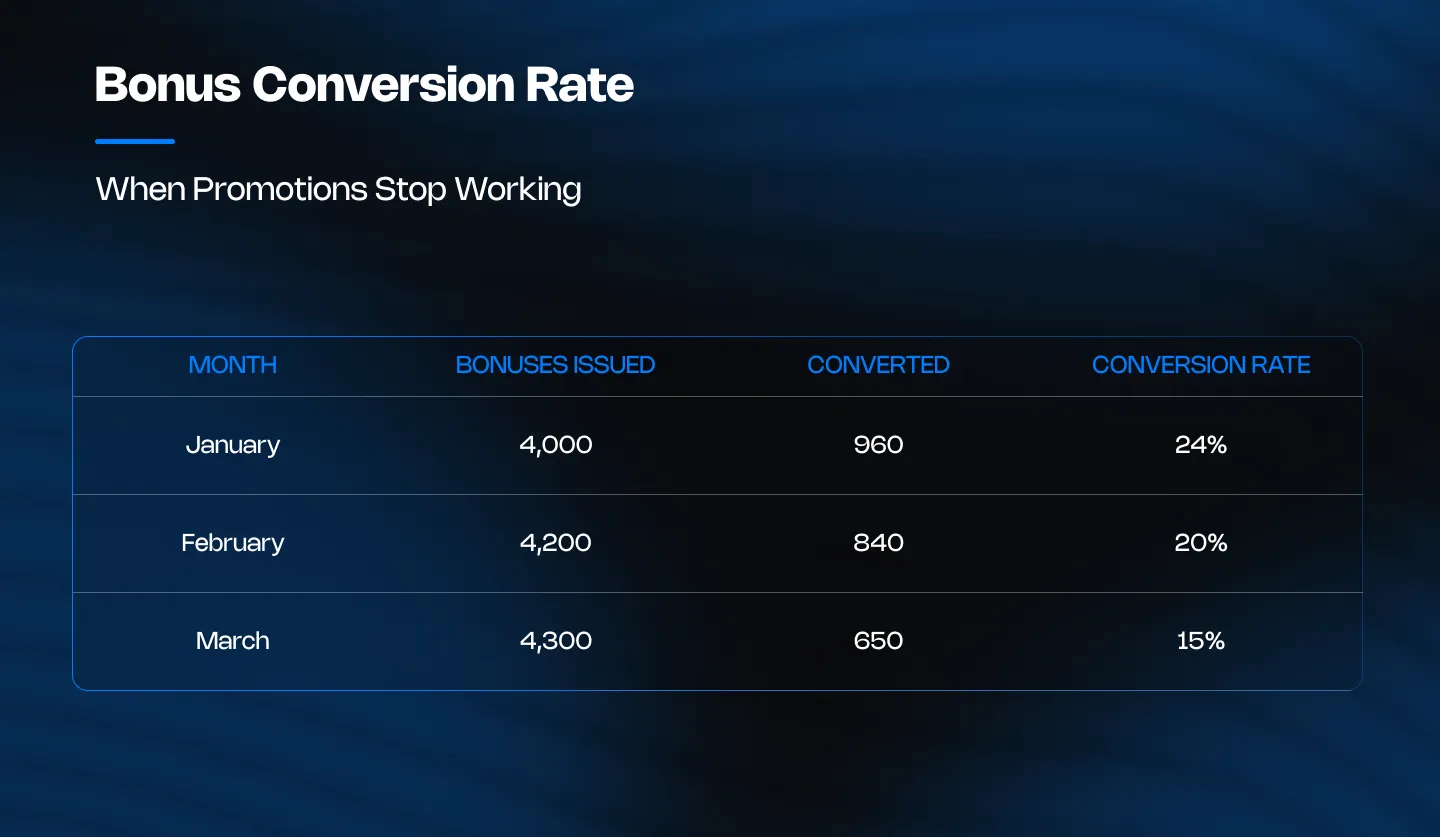
Here, promotion volume increases but fewer players convert them, suggesting declining relevance.
Effective response requires better player segmentation:
- New players respond to onboarding bonuses
- Regular players prefer cashback or free spins
- VIP players respond to personalised rewards
Promotions remain one of the most powerful engagement levers in iGaming — but only when incentives align with player behaviour and value tiers.
Putting It Together – From Metrics to CX Action
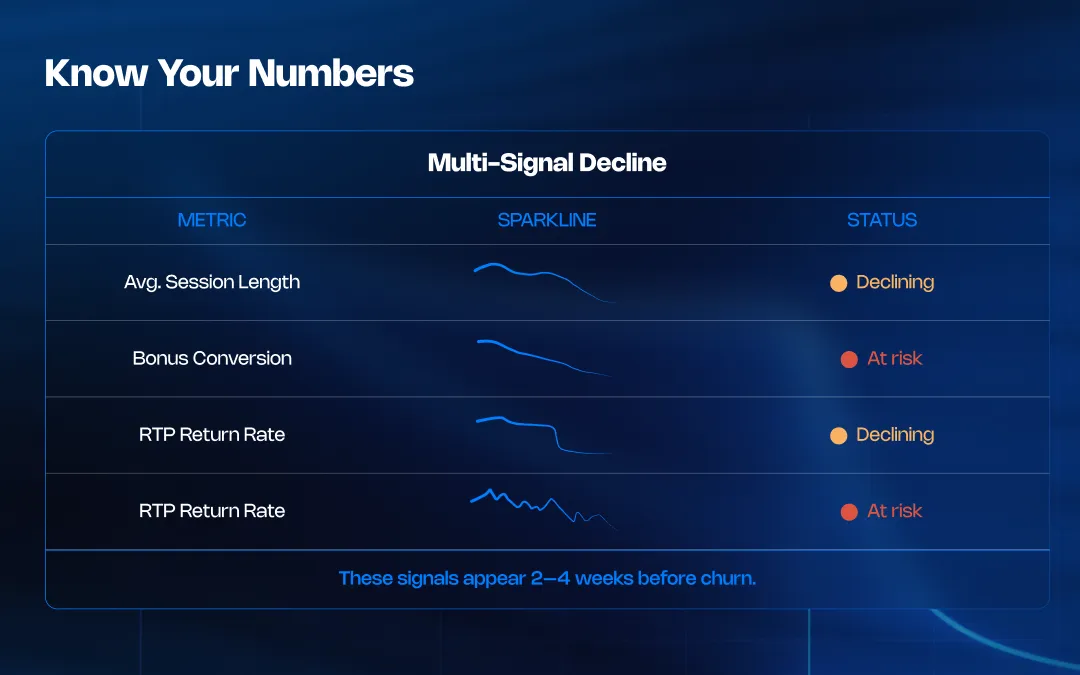
No single engagement metric predicts churn with perfect accuracy. The real value emerges when multiple signals decline simultaneously.
For example:
- DAU/MAU ratio falls
- Session length shortens
- Bonus conversion declines
Together, these metrics indicate systemic disengagement rather than random fluctuation.
CX teams should treat engagement metrics as trigger conditions for intervention rather than passive analytics.
The table below summarises how these signals translate into operational action.
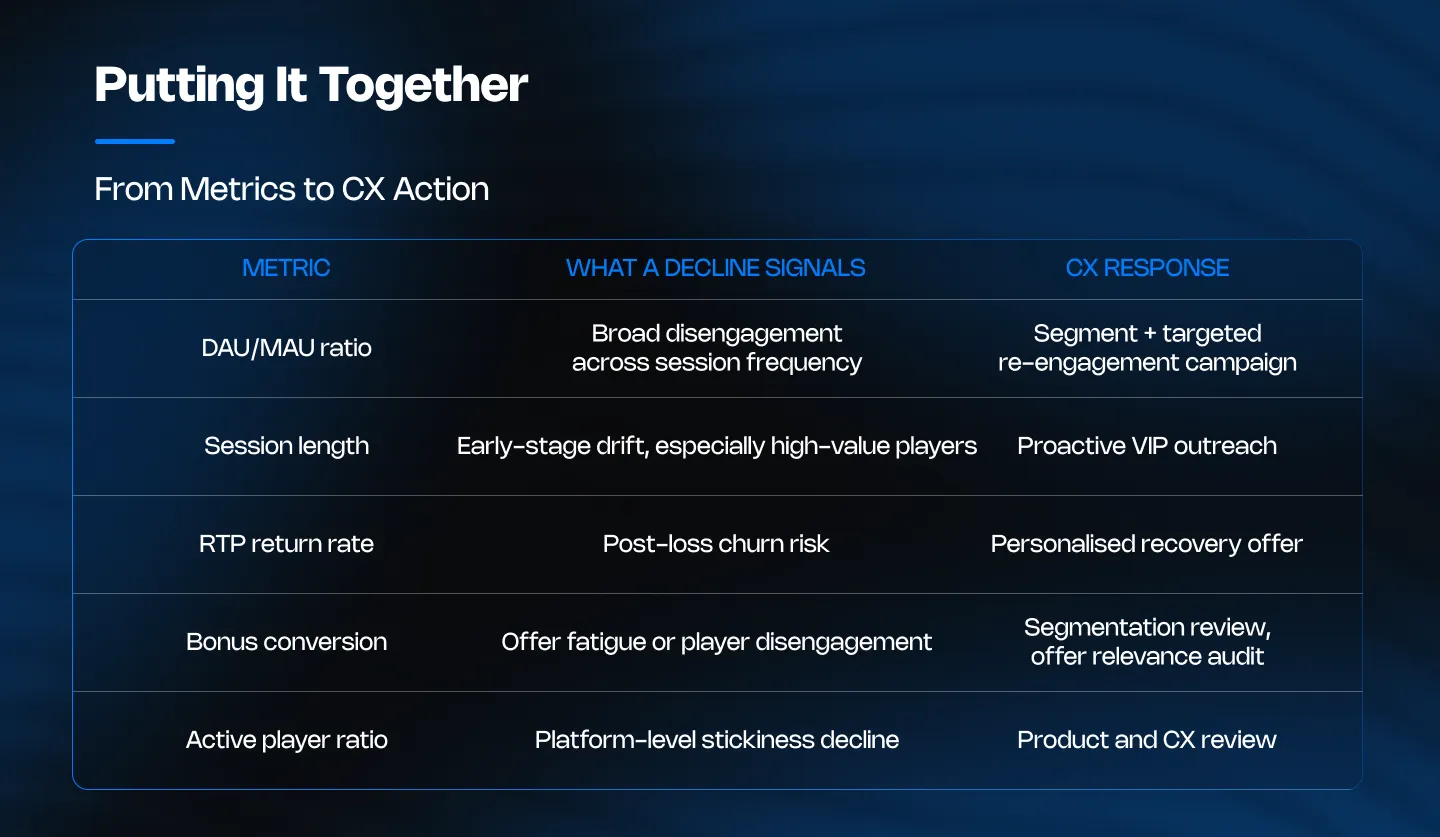
When these metrics are integrated into operational workflows, engagement analytics become a decision system rather than a reporting system.
Operators that act on these signals prevent churn. Operators that ignore them discover the problem only after the players are gone.
Frequently Asked Questions
What is a good DAU/MAU ratio for iGaming?
A DAU/MAU ratio above 0.20 is generally considered healthy in gaming environments. It means at least 20% of monthly players return daily. However, the ideal ratio depends on player mix. Platforms with large casual audiences may see lower ratios, while VIP-heavy platforms typically maintain higher stickiness levels.
How do engagement metrics differ from retention metrics in iGaming?
Engagement metrics are leading indicators, while retention metrics are lagging indicators. Engagement metrics track real-time player behaviour such as session frequency, session length, and promotion interaction. Retention metrics measure completed outcomes, such as players who did not return after 30 days. Engagement shows what players are doing now; retention shows what already happened.
Which iGaming engagement metric predicts churn earliest?
Session length and DAU/MAU trend are typically the earliest predictors of churn. Players often shorten their sessions before reducing login frequency. When session duration declines and the DAU/MAU ratio drops simultaneously, churn risk increases significantly. These signals usually appear two to four weeks before retention reports reflect player loss.
How does CX in gaming (cx gaming) connect to engagement data?
CX teams use engagement data to trigger proactive player interventions. When engagement metrics decline, CX teams can contact players, deliver personalized offers, or initiate VIP outreach before churn occurs. In practice, cx gaming transforms raw engagement data into operational actions that protect revenue and maintain player loyalty.
Conclusion
Engagement metrics reveal player intent long before churn appears in retention reports. Declining DAU/MAU ratios, shortening session lengths, falling bonus conversion rates, and weak RTP return trends are early signals that player behavior is shifting.
Understanding what drives that churn — how it compresses LTV, weakens the PAC ratio, and erodes NGR — starts with the retention metrics covered in Part 1 of this series.
Operators who monitor these patterns gain a critical advantage: they can intervene while players are still active rather than trying to recover them after they disappear.
Turning engagement signals into measurable action requires more than analytics. It requires the operational capacity to reach players at the right moment with the right message.
Converst helps operators transform engagement data into proactive player outreach, reactivation campaigns, and VIP engagement programs that protect player lifetime value. Learn more about how Converst turns player interactions into measurable growth.
In Part 3 of the Know Your Numbers series, we’ll explore the next set of metrics that shape player experience and operational performance.